The most common Power BI story in a small business goes like this. Someone builds a report from a spreadsheet. It looks great. Three months later the spreadsheet changes shape, the totals stop matching the accounting package, and nobody trusts it. A good consultant prevents that by working on the part you don’t see.
Start with the questions, not the charts
Before opening Power BI we ask what you actually want to know. The answers are usually short:
- Which jobs made money last month, and which didn’t?
- How much is still unpaid, and for how long?
- Where do new enquiries come from, and which turn into work?
- Is the schedule full for the next month?
Each question becomes a measure: a number with a plain definition. “Revenue” sounds obvious until you ask whether it means invoiced, paid or booked. We write the definition down once, in a sentence, so the report and the person reading it agree.
Find where the data lives
| Question | Likely source | Common snag |
|---|---|---|
| Profit by job | Accounting package | Job names typed differently each time |
| Enquiries to work | CRM or website forms | Source field left blank |
| Schedule load | Booking or job system | Cancellations still counted |
| Unpaid invoices | Accounting package | Credit notes not netted off |
We check each source for the snag before building anything on top of it. Often the fix is one tidy-up step upstream, such as a required field, which makes every future report better. If your numbers currently live in spreadsheets, our page on an Excel automation expert covers that side.
Model it so the numbers agree
Microsoft’s guidance for Power BI models is star schema. Tables are either dimension tables, which describe things like customers, products and dates, or fact tables, which record events like sales. Dimensions filter and group; the fact table is what gets summarised.
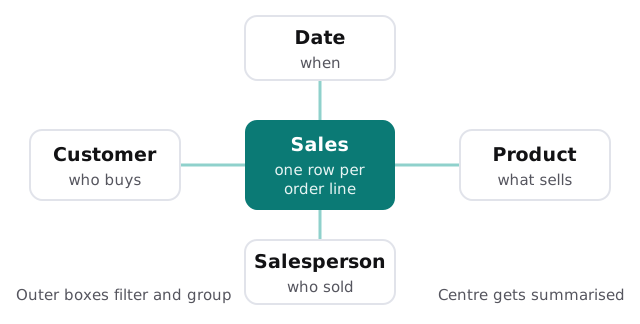
Microsoft also notes that a fact table should load data at a consistent grain, meaning each row means the same kind of thing. That one rule prevents a surprising number of wrong totals. It sounds technical, but it’s really a question for you: what is one row, one order or one order line?
Who can see it
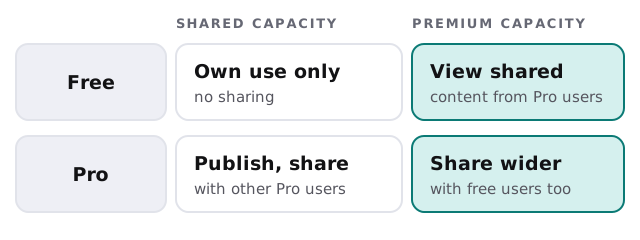
Licensing is worth settling early, because it changes who gets a report and where it lives. From Microsoft’s licence documentation: free users can create reports for their own use but can’t share or publish to others, a Pro licence lets people publish and share with other Pro users, and content in a Premium capacity workspace can also reach free users.
We won’t quote prices here, since they change; Microsoft publishes the current ones.
Keeping it fresh
A model is only useful while the data in it is current. We agree how often each source should update, who gets told when an update fails, and who is allowed to change a measure, so a well-meaning edit doesn’t quietly change last quarter’s numbers.
What you’re left with
- A one-page question list, with a definition for each measure.
- A source map showing where every number comes from.
- A model that matches the star layout above, ready for reports.
- A licence recommendation based on who builds and who only views.
You get a plan and a fixed quote before we build. For the report-building step itself, see Power BI dashboard development. If you want a lighter option powered by AI, our AI KPI dashboard page explains that route, and stock-heavy businesses may prefer an inventory dashboard.
A dashboard shows you a number. A consultant makes sure it’s the same number everywhere.